At one point in my career, I was hired to manage the digital marketing for a particular Israeli start-up, which would ultimately end up folding over two months later due to a lack of successful fundraising. During this period of time, the CEO had asked me to create an Excel spreadsheet and PowerPoint for promising investors on the potential for market penetration.
Supposedly, the start-up had had a way to convert speech to text in some new, exciting manner (the product would automatically transcribe voicemail and then send it to you over e-mail or text message), and the goal, I was told, was to exit by selling to Google. First, however, they needed to obtain investment and subsequently show successful sales and usage within various test markets.
I was to research the number of mobile-phone users in various countries and then estimate a “capture rate” of one percent and monthly revenue of $10 per user. (This data is only an example – this occurred years ago, and I do not remember the exact information.) So, basically, here is what the CEO had presented to potential investors:
Country X
10 million mobile-phone users X 0.01 capture rate = 100,000 users
100,000 users X $10 fee per month = $1 million in revenue per month
This process was repeated for four additional countries. Assuming a capture rate of one percent – if only 1 in a 100 people would use the technology – the total revenue would be enormous.
Unfortunately, for both me and the company, it did not work out. However, the idea of a “capture rate,” also known as “conversion rate,” is a principle that has continued to increase in importance since I was laid off from the start-up years ago. Like in the formula above, even a miniscule change in the capture rate would change the firm’s gross profits by millions of dollars. As is plainly illustrated, a rising or falling conversion rate can severely affect your sales.
If you have a website, a PPC landing page, a Facebook page, or anything similar, your goal is likely (or should be!) to engage users actively. Whether by downloading a mobile app, signing up for an e-mail newsletter, requesting information, purchasing a product, or something else (depending on your marketing and business goals), your ultimate objective should user participation. In relation, the conversion rate is what percentage of the incoming traffic takes that action.
Conversions can occur in many places: a form that is highly visible on your website; a tab on your Facebook page; a clickable button on a PPC landing page; a link in a tweet, LinkedIn update, or e-mail newsletter; and so on. Additionally, each method will likely have a different, generalized conversion rate: For example, Facebook is normally not very effective in B2B marketing (it’s more B2C), so, in a B2B context, e-mail newsletters or LinkedIn advertising campaigns might lead to higher conversion rates.
The key is to test early and to test often. While every business wants to see results quickly, in the long term, initial testing will lead to better overall results. For example, instead of merely assuming that a Facebook advertising campaign will generate the best return and consequently sinking your entire $100,000 marketing budget directly into it, it may be better to test Facebook, Twitter, LinkedIn, and Google PPC campaigns for a week by allocating $1,000 for each platform. Afterwards, you will not only be able to see which mediums have the best conversion rates but will then be able to apportion your remaining budget accordingly. As a result, the increased conversions and sales would more than cover the $3,000 tested on other mediums.
Still, your testing would not yet be complete.
A whole subset of the online-marketing industry has developed around the practice of “conversion-rate optimization” (CRO). This optimization technique relates to increasing a website’s conversion-rate percentage through the constant tweaking and testing of items including keyword targets, website text, graphic designs, and calls to action. (You can see an example of a conversion funnel and its data at the top of this post.)
One example: Say that your PPC traffic generally has a conversion rate of 30% and is the best-performing medium. CRO would aim to get that number even higher by sending different batches of traffic to different landing pages to see which types of pages perform the best.
As with scientific experiments, the best practice is to isolate and test multiple variables individually. (If there is only one difference between two items, then any change in performance must be a result of that difference.) If five pages differ only in their background colors, then you can see which hue performs the best. A similar situation could be seen when only the text in pages’ call-to-action buttons differs. The scenarios go on and on.
Once you test and subsequently know which specific elements perform the best, you would then be able to combine these elements into a single PPC landing page. If your conversion rates increase, let’s say to 45%, after this testing process, the increased sales from that point on will have been well worth the time and money.
Because, obviously, the product had not yet been sold, the CEO at my old company did not have any real data on capture or conversion rates. However, in the online world, it is easy – and crucial – to research and test for the best results.
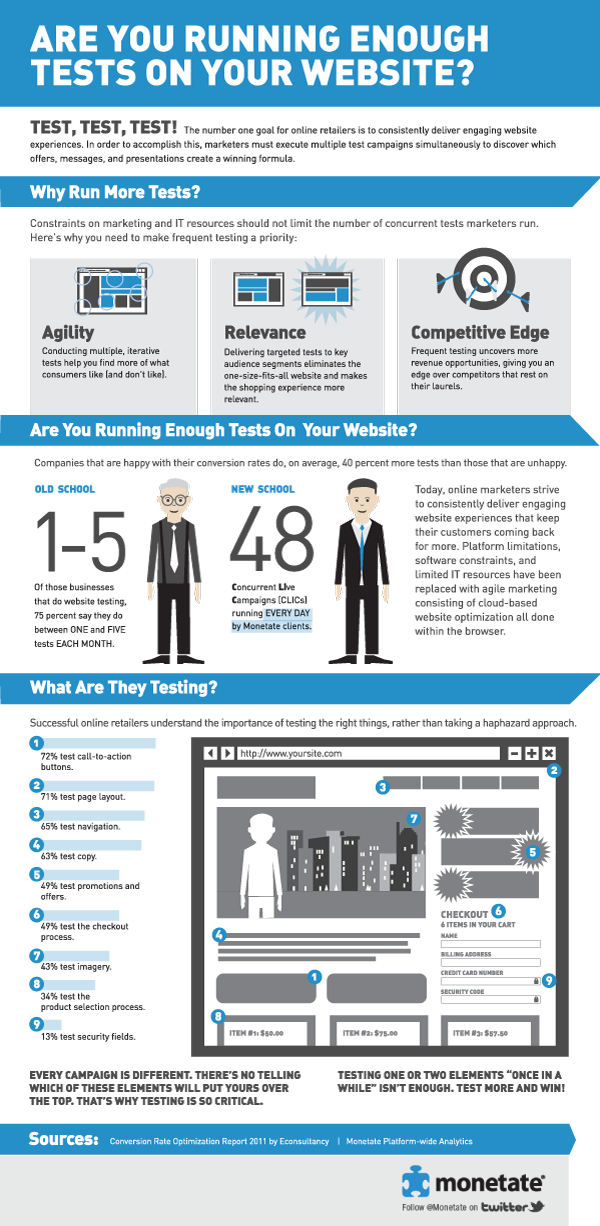
And what can – and should – you test? Here’s an infographic by Monetate on what businesses are already testing on their websites:
Many clients ask me, “What is a good conversion rate?” To be honest, there is no answer to that question because every website, industry, and sector is different. A better question is, “What is our conversion rate now, and how can we make it better?” And the answer is simple: Test early and test often.